Belt Filter Press Reliability with Weibull Analysis
Discover how Weibull analysis improves Belt Filter Press reliability. Explore MTBF, failure rates, and predictive maintenance for asset performance.
Understanding Reliability Metrics
To kick off our journey, let’s delve into essential reliability metrics. Mean Time Between Failures (MTBF) is a crucial indicator, representing the average time a system operates before experiencing a failure. In our BFP example, MTBF provides insights into the expected operational lifespan.
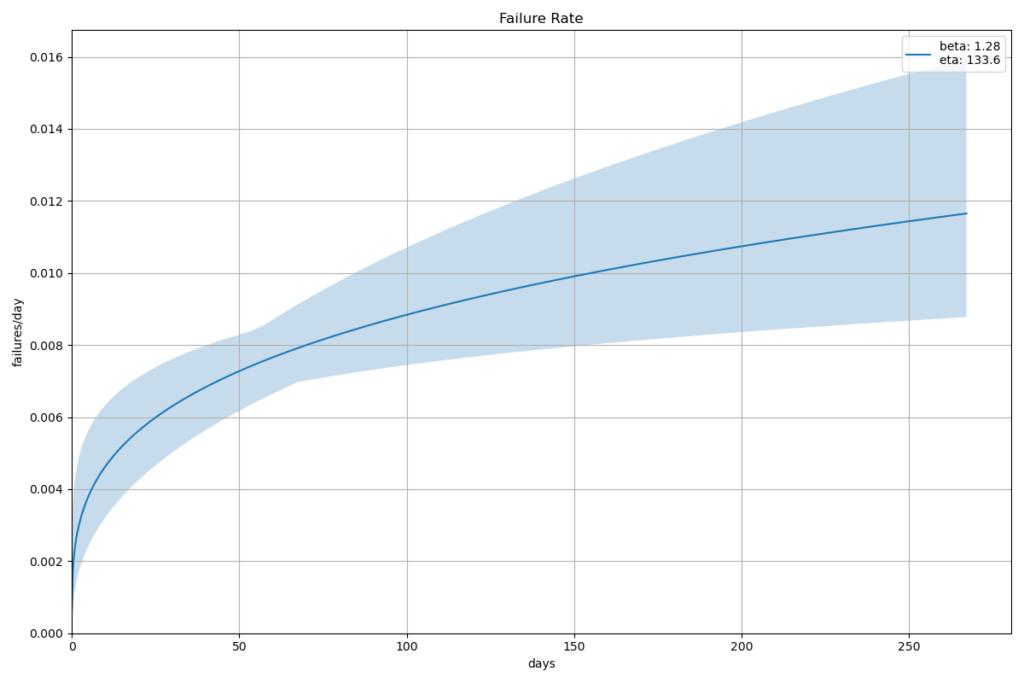
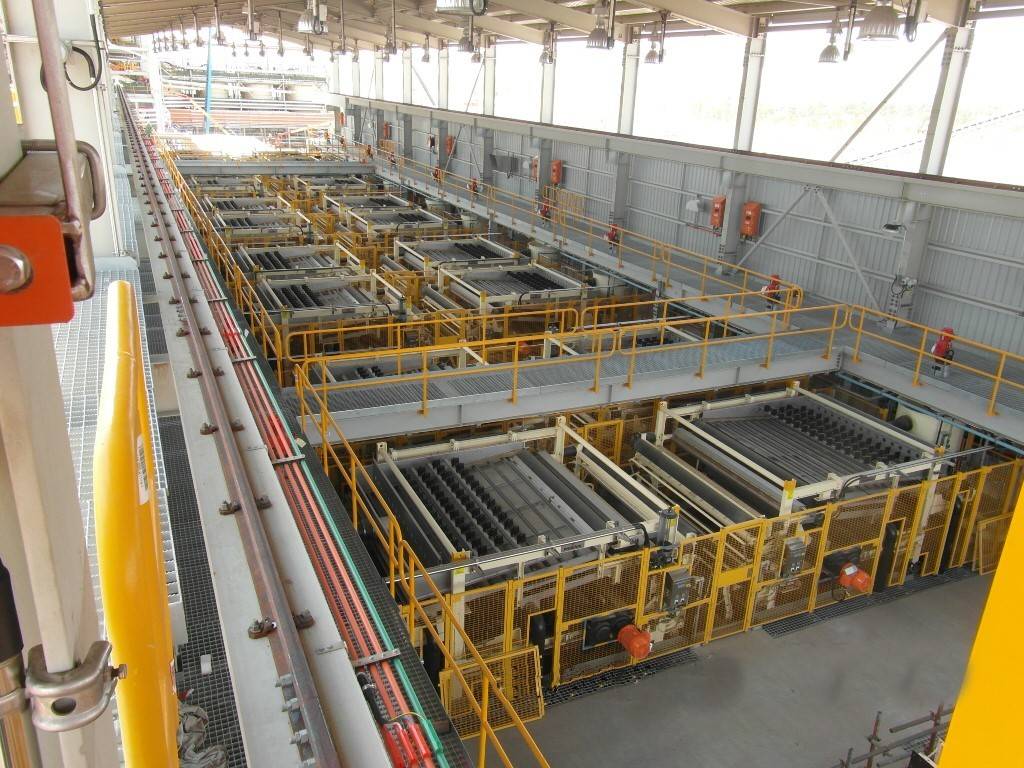
We further explore the Failure Rate, or hazard rate, which signifies the rate at which failures occur over time. By visualizing this data through a Failure Rate Curve, we gain valuable insights into the system’s vulnerability to failures at different points in time. The focus of the analysis was specific to the failures of the “Top Cloth” out of a population of 12 machines over a period of 5 years.
The Power of Weibull Analysis
The Weibull distribution emerges as a powerful tool for reliability analysis. Our exploration of Weibull parameters, such as shape (beta) and scale (eta), reveals valuable information about the failure characteristics of the BFP. The shape parameter indicates the pattern of the failure rate, with values greater than 1 suggesting an increasing failure rate – a critical insight for maintenance planning and Asset Performance.
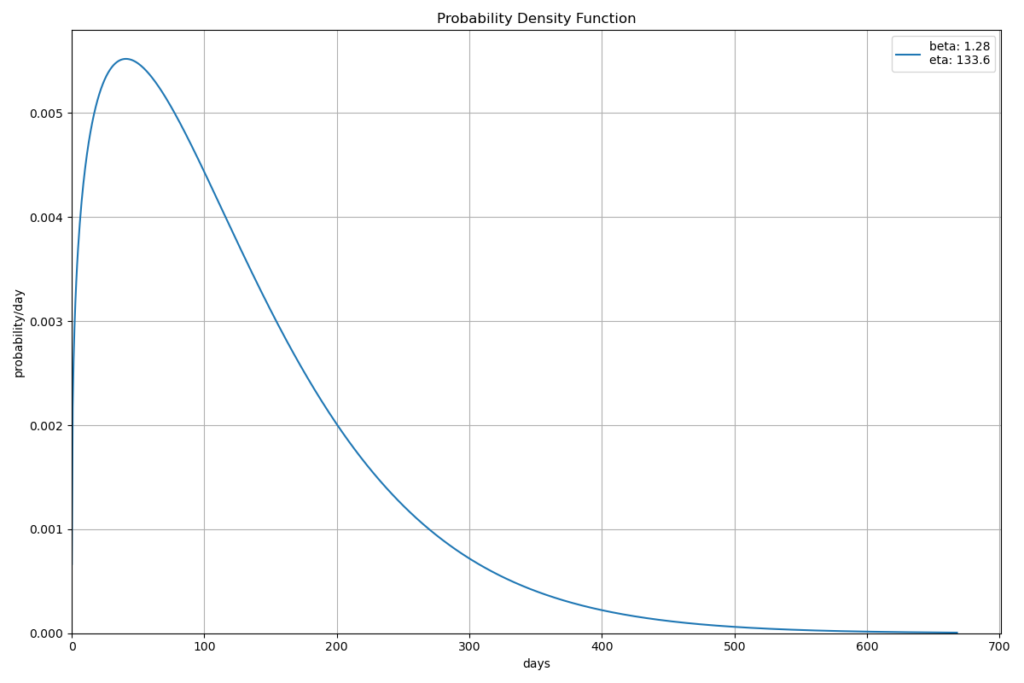
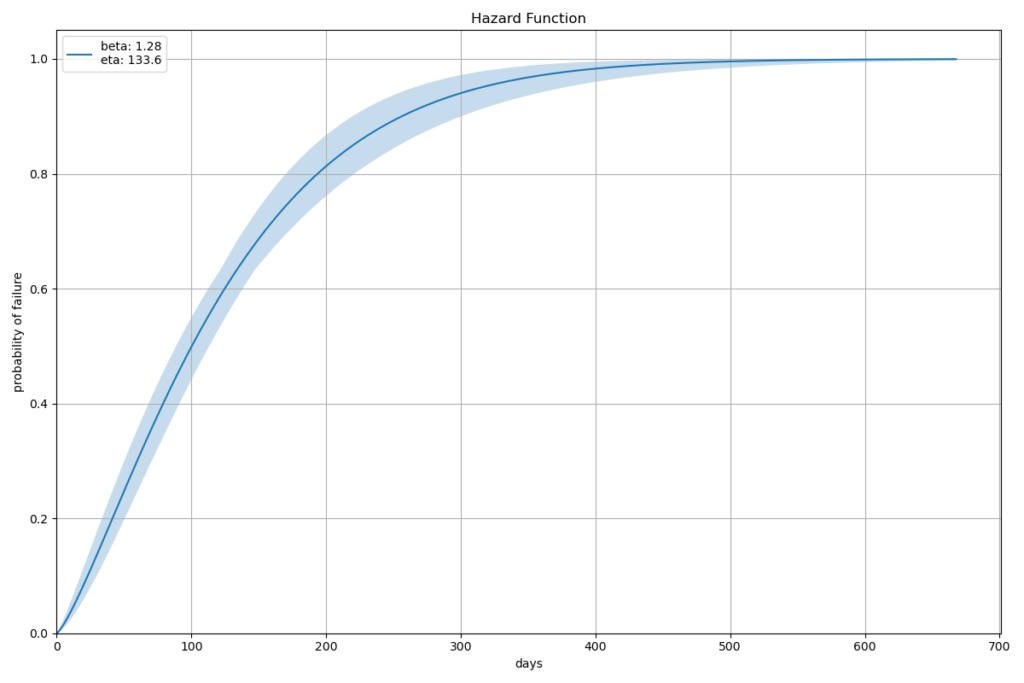
Through Probability Density Function (PDF) and Cumulative Distribution Function (CDF) or Hazard Function plots, we visually assess how well the Filter Press failure data aligns with the Weibull distribution. These plots provide a distinct understanding of the data distribution and aid in model validation.
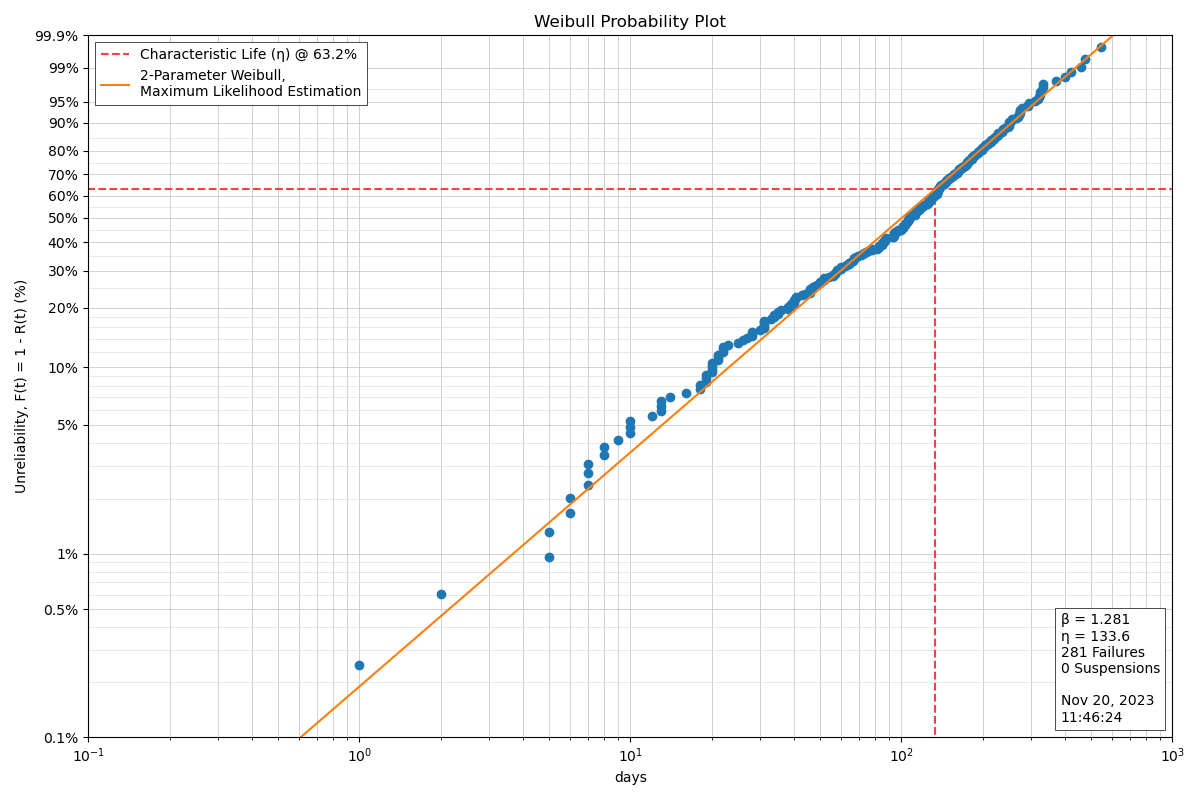
using Maximum Likelihood Method (MLE).
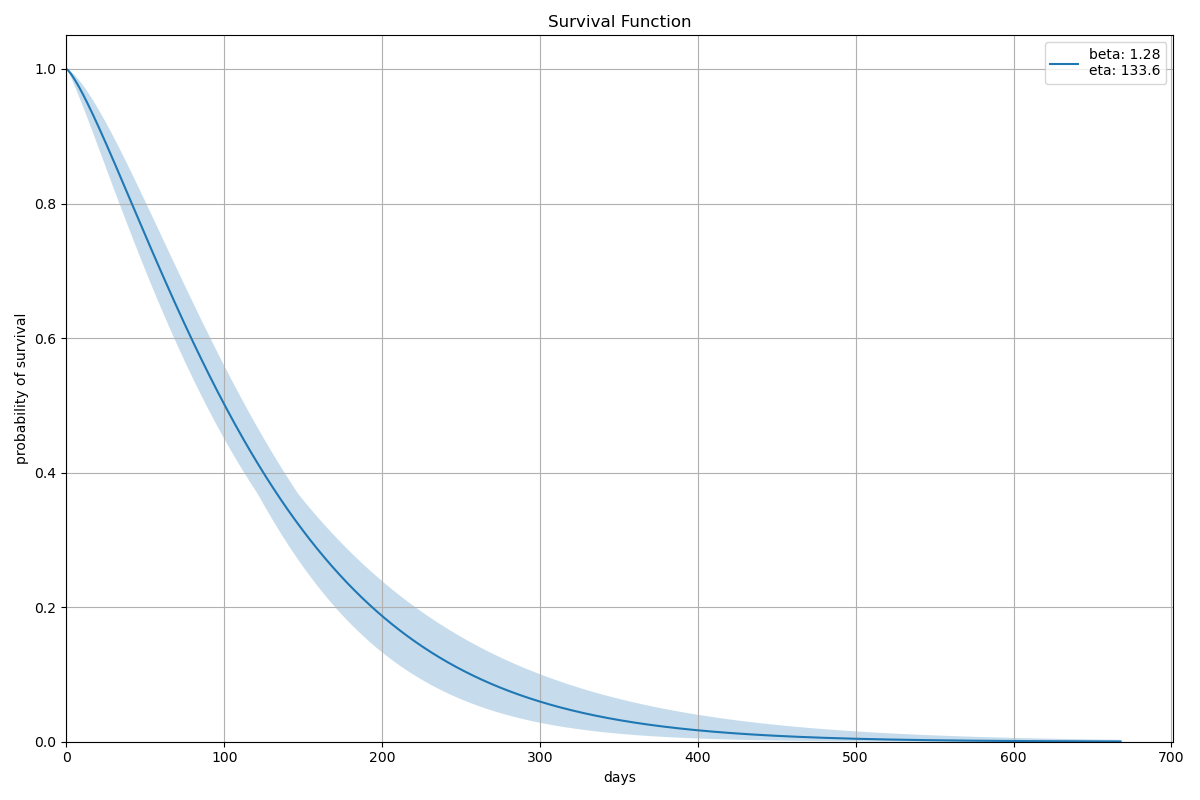
Function – 95% confidence bounds.
Practical Applications
We apply Weibull analysis to estimate the MTBF, offering a quantitative measure of the system’s reliability. The chi-square goodness-of-fit test ensures the robustness of the Weibull model, validating its appropriateness for the given dataset.
The confidence intervals for Weibull parameters add a layer of uncertainty analysis, crucial for decision-making. Moreover, the analysis of Weibull parameters at different confidence levels enhances the reliability of the predictions.

Critical Examination and Recommendations
While Weibull analysis offers valuable insights, it’s essential to acknowledge its limitations. The assumption of a constant shape parameter throughout the system’s life may not always hold true. Real-world systems might experience changes in failure characteristics over time, necessitating periodic re-evaluation of the Asset Performance Weibull model.
The application of Weibull analysis also requires a substantial amount of failure data to yield accurate results. In scenarios with limited failure events, the reliability of predictions diminishes. Additionally, the accuracy of Weibull analysis heavily relies on the quality of failure data and the assumption that the failures are independent and identically distributed.
Technology and Tools
In the era of advanced technology, machine learning and predictive analytics offer promising avenues for reliability analysis. Integrating sensor data, real-time monitoring, and predictive models can enhance the precision of failure predictions. Furthermore, modern reliability-centered maintenance (RCM) strategies leverage data-driven insights to optimise maintenance schedules.
Conclusion
We conclude our exploration with a holistic understanding of reliability analysis, Weibull distribution, and their applications in the context of Belt Filter Presses. While Weibull analysis remains a robust and widely-used tool, it’s crucial to approach it with a critical mindset, considering the dynamic nature of real-world systems.
As technology evolves, the integration of predictive analytics and machine learning presents exciting possibilities for refining reliability predictions. The journey towards optimal reliability and maintenance strategies involves a continuous loop of analysis, adaptation, and innovation, ensuring the longevity and efficiency of critical assets in industrial landscapes.
Keywords: Reliability Analysis, Asset Performance, Predictive Maintenance, Python Programming, Weibull Analysis, Failure Rate, MTBF (Mean Time Between Failures), RCM (Reliability-Centered Maintenance), Survival Analysis, Condition Monitoring, Data-driven Decision Making.